|
Geography
Class - XII 2000 (CBSE)
You are on Set no 1 Qno. 1 to
12
Q1)
"India is neither a
pigmy nor a giant". Elaborate this statement by giving three
suitable examples. (Marks 3)
Q2)
Where is the
Bhabhar land situated in India? Write its two characteristics.
(Marks 3)
Q3)
Write three
differences between the regions of the first order and the regions
of the second order? (Marks 1x3)
Q4)
Suggest three
measures to check rapid population growth in India.
(Marks 1x3)
Q5)
State in brief
three factors determining the type of rural settlements.
(Marks 1x3)
Q6)
Why are scheduled
castes mainly concentrated in alluvial and coastal plains of India?
Give three reasons.
Q7)
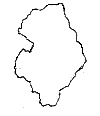
Draw or trace in
your answer book the outline map of Baster Tribal district as given
below and show therein the following:

1. Bailadila iron ore
mines
2. Abhujmar Hills
3. Region inhabited by
Parja tribal group
4. Region inhabited by Dorla
Tribe.
Q8)
Explain three
factors which are responsible for regional differentiation and
diversities in India. (Marks 1x3)
Q9)
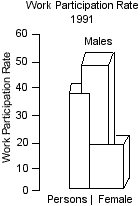
Study the following
graph and answer the questions that follow:-

Q9.1)
What is the work participation rate of females?
Q9.2) What
is the work participation rate of males?
Q9.3) What is the
combined average rate of participation of males and females?
Q10) Study the table given below
and the questions that follow.
| POPULATION GROWTH IN INDIA (1901-1991) |
| Decade |
Birth Rate |
Death Rate |
Natural Increase |
Annual Growth Rate
(in percentage) |
| 1901-11 |
49.2 |
42.6 |
6.6 |
0.6 |
| 1911-21 |
48.1 |
47.2 |
0.9 |
0.09 |
| 1921-31 |
46.4 |
36.3 |
10.1 |
1.01 |
| 1931-41 |
45.2 |
31.2 |
14.0 |
1.40 |
| 1941-51 |
39.9 |
27.4 |
12.5 |
1.25 |
| 1951-61 |
41.7 |
22.8 |
18.9 |
1.89 |
| 1961-71 |
41.2 |
19.0 |
22.2 |
2.22 |
| 1971-81 |
37.2 |
15.0 |
22.2 |
2.22 |
| 1981-91 |
32.7 |
11.7 |
21.0 |
2.1 |
Q10.1) In which two decades was
the annual growth rate highest?
Q10.2) In which decade was
the annual growth rate the lowest? Give one reason based on the
table.
Q10.3) In which decade was the death rate lowest?
What was its effect on the growth rate in that
decade?
Q11) Study the temperature and
rainfall data of the four stations as given in the following table
and answer the questions that follow:
|
Temperature and
Rainfall Data of Selected Stations |
| Months |
| Station |
|
J |
F |
M |
A |
M |
J |
J |
A |
S |
O |
N |
D |
| Leh |
ToC
R cm |
-8.5
10 |
-7.2
0.8 |
-0.6
0.8 |
6.1
0.5 |
10.0
0.5 |
14.4
0.5 |
17.2
1.3 |
16.1
1.3 |
12.2
0.8 |
6.1
0.5 |
0.0
- |
-5.6
0.5 |
| Delhi |
ToC
R cm |
14.4
2.5 |
16.7
1.5 |
23.3
1.3 |
30.0
1.0 |
33.3
1.8 |
33.3
7.4 |
30.0
19.3 |
29.4
17.8 |
28.9
11.9 |
25.6
1.3 |
19.4
0.2 |
15.6
1.0 |
| Mumbai |
ToC
R cm |
24.4
0.2 |
24.4
0.2 |
26.7
- |
28.3
- |
30.0
1.8 |
28.9
50.6 |
27.2
61.0 |
27.2
36.9 |
27.2
26.9 |
27.8
4.8 |
27.2
1.0 |
25.0
- |
| Chennai |
ToC
R cm |
24.5
4.6 |
25.7
1.3 |
27.7
1.3 |
30.4
1.8 |
33.0
3.8 |
32.5
4.5 |
31.0
8.7 |
30.2
11.3 |
29.8
11.9 |
28.0
30.6 |
25.9
35.0 |
24.7
13.9 |
T = Mean
monthly temperature in oC
R = Average monthly
rainfall in cms |
Q11.1) What is the annual range of
temperature at Delhi?
Q11.2) Name the station which
receives maximum rainfall during the retreating
season.
Q11.3) What is the annual mean temperature at
Leh?
Q11.4) Which station receives the higher annual
precipitation?
Q12) What is soil
erosion? Describe three methods to check soil erosion.
|
