|
Geography
Class - XII 1997 (CBSE)
You are on Set no. I questions 1 to 10
Q1) Name the six major racial
group from which the population of the Indian sub continent has been
derived.
Q2) Define settlement pattern.
Name the two components which basically define a settlement
pattern.
Q3) "The seas surrounding the
shores of India have played a vital role in determining the nature
of interaction of the Indian people with those of the surrounding
regions." Explain the above statement by giving them supportive
arguments.
Q4) Where are the Moist Tropical
Evergreen forests found in India? Explain one way in which this
vegetarian is similar to the equatorial forests, and one way in
which it is dissimilar to it.
Q5) "The centripetal and
centrifugal forces are responsible for producing a balance of Unity
in Diversity in the Indian polity." Explain the above statement by
giving these suitable examples.
Q6) Why is greater attention being
paid to the uplift of the scheduled caste population in India.
Discuss the distribution pattern of Schedule Caste population with
reference to two state having (a) high (b) low concentration.
Q7) Study carefully the table
given below and then answer the following questions:-
| INDIA : CLASSIFICATION OF WORKING
POPULATION |
|
ITEM |
1991
(in
millions) |
|
TOTAL WORKERS
Of
which
RURAL
URBAN
MALE
FEMALE
MAIN
MARGINAL |
306.0
241.7
64.3
218.6
87.4
278.9
27.1
|
Q7.1) Why is the total number of
workers more in the rural areas than in urban areas?
Q7.2)
Why is the number of female workers less than that of the male
workers? Would it be right to say that the working population in
India is male dominated?
Q7.3) Who are marginal workers?
Why is their number so small as compared with the main
workers?
Q8) Study the table given below
and then answer the following questions.
| Crops |
Area
(in lakh hectares) |
Production
(in lakh tonnes) |
Yield
(in kg. per hectare) |
| 1950-51 |
1993-94 |
1950-51 |
1993-94 |
1950-51 |
1993-94 |
Rice
Maize
Pulses |
388
32
191 |
420
60
224 |
206
17
55 |
790
95
131 |
668
547
363 |
1879
1583
584 |
Q8.1) What is the proportionate
increase in the production of rice during the period 1950-51 to
1993-94?
Q8.2) Which item in the above is mainly
responsible for the increased production?
Q8.3) Suggest
two reasons for that item helping in the increase in
production.
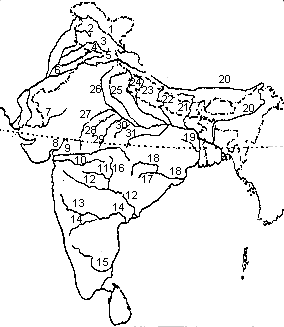
Q9) Write the names of the rivers
indicated in the map given below by numbers 3, 7, 12, 20, 26 and 27.
Also write their number along side.

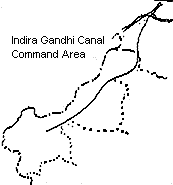
Q10) Keeping the above outline map
as base, draw a sketch map of Indira Gandhi Canal Command Area, and
in it mark and label.

10.1 Area irrigated
'under lift'
10.2 The cities of Bikaner and Jaisalmer.
|
