|
 Brainstorming Brainstorming  Decision Trees Decision Trees
Critical Path AnalysisCritical Path Analysis is an extremely effective method of analysing a complex project. It helps you to calculate the minimum length of time in which the project can be completed, and which activities should be prioritised to complete by that date. Where a job has to be completed on time, critical path analysis helps you to focus on the essential activities to which attention and resources should be devoted. It gives an effective basis for the scheduling and monitoring of progress. Sequential and parallel activitiesThe essential concept behind Critical Path Analysis is that some plan activities are dependent on other activities being completed first. For example, you should not start building a bridge unless you have designed it first! These dependent activities need to be completed in a sequence, with each activity being more-or-less completed before the next activity can begin. Dependent activities are also called 'sequential' activities. Other activities are not dependent on completion of any other tasks, or may be done at any time before or after a particular stage is reached. These are non-dependent or 'parallel' tasks. MethodThe process of carrying out a critical path analysis is shown below:- List all activities in plan
Show the earliest start date, estimated duration and whether the tasks are parallel or sequential. If the tasks are sequential, show what they depend on..This will show a task list like them one below (simplified custom written computer installation): NB: Start week shows purely when resources become available. Whether a task is parallel or sequential depends largely on context. - 1. High level analysis start week 1, 5 days, sequential
- 2. Selection of hardware platform start week 1, 1 day, sequential, dependent on (1)
- 3. Installation and commissioning of hardware start week 3, 2 weeks, parallel dependent on (2), any time after
- 4. Detailed analysis of core modules start week 1, 2 weeks, sequential dependent on (1)
- 5. Detailed analysis of supporting utilities start week 1, 2 weeks, sequential dependent on (4)
- 6. Programming of core modules start week 4, 3 weeks, sequential dependent on (4)
- 7. Programming of supporting modules start week 4, 3 weeks, sequential dependent on (5)
- 8. Quality assurance of core modules start week 5, 1 week, sequential dependent on (6)
- 9. Quality assurance of supporting modules start week 5, 1 week, sequential dependent on (7)
- 10.Core module training start week 7, 1 day, parallel dependent on (6), any time after
- 11.Development of accounting reporting start week 6, 1 week, parallel dependent on (5), any time after
- 12.Development of management reporting start week 6, 1 week, parallel dependent on (5), any time after
- 13.Development of management analysis start week 6, 2 weeks dependent on (5), any time after
- 14.Detailed training start week 7, 1 week, sequential dependent on (1-13)
- 15.Documentation start week 4, 2 weeks, parallel
- Head up graph paper with the days or weeks through to task completion
- Plot the tasks on the graph paper
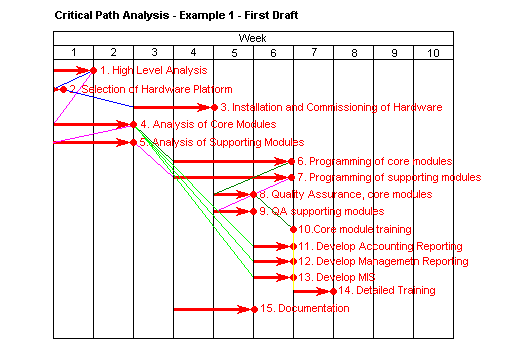
Start on the earliest start dates, and mark on the duration. Show the tasks as arrows, and the ends of tasks with dots. Above the tasks arrows, mark the time taken to complete the task. Do not worry about task scheduling yet - all we are doing is setting up the first draft of the analysis.Once you have plotted the tasks, plot in lines to show dependencies. This will produce an untidy draft analysis like the one below:  - Schedule Activities
Take the draft analysis, and use it to schedule the actions in the plan, in such a way that sequential actions are carried out in the required sequence. Parallel actions should be scheduled so that they do not interfere with sequential actions on the critical path, if possible. While scheduling, bear in mind the resources you have available, and allow some slack time in the schedule for hold-ups, over-runs, failures in delivery, etc.
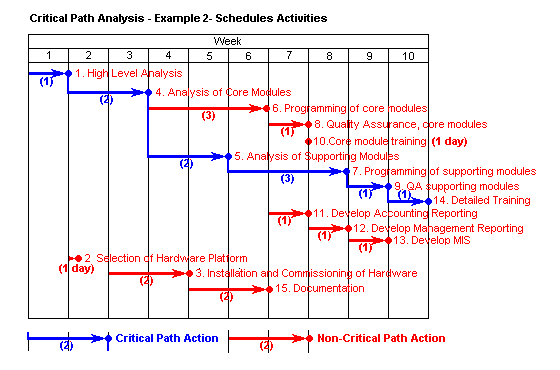
Presenting the AnalysisThe final stage in this process is to prepare a clean final copy of the analysis. This should combine the draft analysis (see above) with your scheduling and analysis of resources to show when you anticipate that jobs should start and finish.There are two formats for this clean copy. The choice of the most effective form of presentation comes down to the circumstances of the analysis and personal taste. - Gantt ChartsA redrawn and scheduled version of the analysis above is shown below, in the format of a modified Gantt chart:
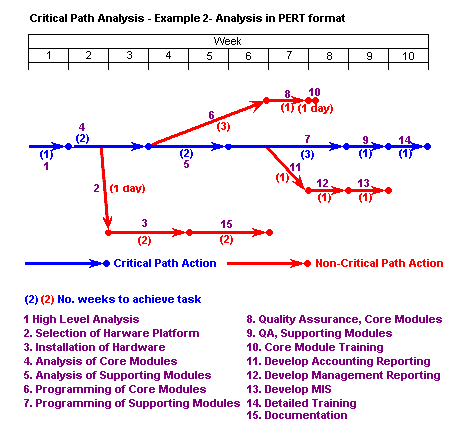
 Here time is marked out in columns across the chart, with individual tasks represented as arrows terminating at dots. The length and positions of the arrows show the start date and duration of the tasks. You may prefer to show tasks in pure Gantt format, as solid bars rather than arrows terminating in dots. Similarly you may prefer not to show the linkages between related tasks - this is a matter of personal taste and personal convention. The Critical Path is the longest sequence of dependent activities that lead to the completion of the plan. Any delay of a stage in the critical path will delay completion of the whole plan unless future sequential activities are speeded up. - PERT ChartsPERT stands for Programme Evaluation and Review Technique. Here circles represent completion of tasks, with linking lines showing the time taken to achieve the tasks. The critical path for the project is shown as the horizontal series of tasks.
Note that in the diagram below we are using dotted lines to link completed tasks back to the appropriate stages of the critical path. These lines serve to tidy the diagram and do not represent tasks to be carried out. This diagram shows our example critical path analysis in PERT format: 
Carrying out the example critical path analysis above shows us: - That if all goes well the project can be completed in 10 weeks
- That if we want to complete the task as rapidly as possible, we need:
- 1 analyst for the first 5 weeks
- 1 programmer for 6 weeks starting week 4
- 1 programmer for 3 weeks starting week 6
- Quality assurance for weeks 7 and 9
- Hardware to be installed by the end of week 7
- That the critical path is the path for development and installation of supporting modules
- That hardware installation is a low priority task as long as it is completed by the end of week 7
SummaryCritical Path Analysis is an effective and powerful method of assessing:- Tasks which must be carried out
- Where parallel activity can be carried out
- The shortest time in which a project can be completed
- Resources needed to achieve a project
- The sequence of activities, scheduling, and timings involved
- Task priorities
- etc.
An effective critical path analysis can make the difference between success and failure on complex projects, and can be an effective tool for assessing the importance of problems faced during the implementation of the plan. |

